How do I use the MnTopo application?
Overview
MnTopo is a web application for viewing and interacting with high-resolution elevation data for Minnesota that was collected using lidar technology. It runs on a variety of devices, including desktops, tablets, and mobile phones. This help page is organized into three sections, starting with an overview of the application's features and a description of the interface, followed by more detailed help for displaying maps and finding elevation information for points and lines.
For more information about accessing GIS layers for detailed analysis, please review the Accessing in GIS Software section of the help page. A list of available layers and links to the resources available on the Minnesota Geospatial Commons can be found on MnGeo's lidar homepage.
Functionality and Data Access
The MnTopo application allows users to quickly explore elevation data:
- Use the point elevation tool to click on a place to get its elevation.
- Use the elevation profile widget draw a line to create an elevation profile graph and download an elevation profile as a CSV directly from the MnTopo web application.
- View supplemental data layers, including contours, FEMA floodplains, hillshade, and flight swaths.
- Explore flight swath metadata by clicking on a flight swath and viewing the linked metadata page.
Data download:
- Due to the size of the datasets, direct download of lidar data through the MnTopo web application is not available at this time. Instead, it is recommended that users connect to the COG or VRT through a desktop GIS application such as ArcGIS Pro or QGIS, and clip the raster to the necessary project extent. Please view the Download Instructions FAQ Page for more details.
- If you require downloaded data for a project but do not have access to desktop GIS software, please contact MnGeo for assistance: gisinfo.mngeo@state.mn.us
The Data Access FAQ Page provides instructions for accessing MnTopo data in GIS software, for the purpose of direct analysis, or to clip and download portions of the dataset as necessary.
Map Display
The MnTopo application lets you choose several layers of information to display over your choice of background basemap.
- Toggle between OpenStreetMap and Esri satellite imagery basemaps.
- View additional layers including contour lines at 2-foot, 10-foot, and 50-foot intervals, flight swaths, statewide hillshade, and FEMA floodplain boundaries.
- Interact with the flight swath layer to access metadata information related to the lidar collection, including the flown dates for each flight swath polygon. Other collection details are included in the linked metadata file corresponding to each lidar acquistion work unit.
Qualifications
Data shown and provided is subject to the disclaimers provided in the data documentation. The statewide data was collected in several acquisition blocks; please review metadata for individual lidar collection work units. MnTopo is not meant to provide high accuracy profiles required by some applications.
Elevation information
Point Elevation
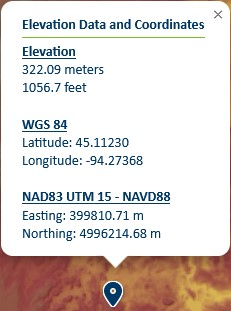
Access point elevation data by using the point elevation widget. The pop-up displays the elevation at the point in meters and feet, as well as the coordinates of the location in WGS 84 and NAD 83 datums.
- Click the widget icon to start the tool:

- Click on the map to get point elevation for 1st and 2nd Generation DEMs at that location. Click the widget icon again to deselect the tool. Please note that elevation data is only available for points within the existing statewide seamless DEM:
Elevation Profile
- Draw a line to create an elevation profile by using the elevation profile widget. Click the widget icon to start to the tool:

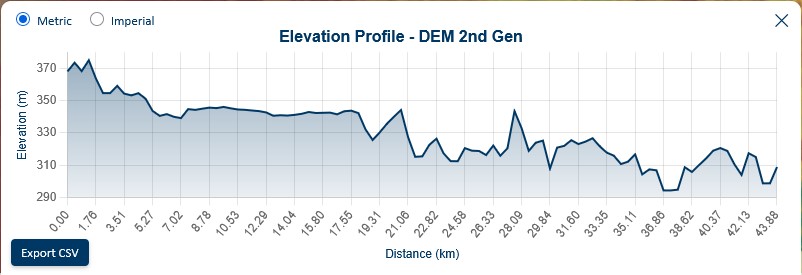
- Click on the map to start drawing. You may click once to drop a point, or double-click to complete the line profile. Once complete, an elevation profile graph will automatically pop up showing profiles for the 1st and 2nd Generation DEM data. You may view the graph in meters or feet, and download the 1st or 2nd Gen profiles as a CSV by clicking the "Export 2nd/1st Gen CSV" button. Click the widget icon again to deselect the tool.
- The MnTopo 2 application generations the profile by taking the coordinates of the user-drawn line and generating 100 evenly spaced sample points along its length. This process is called interpolation, where additional points are calculated between the original vertices of the line so that the spacing between points is consistent from start to finish.
Download
- Click the download widget to start the tool:

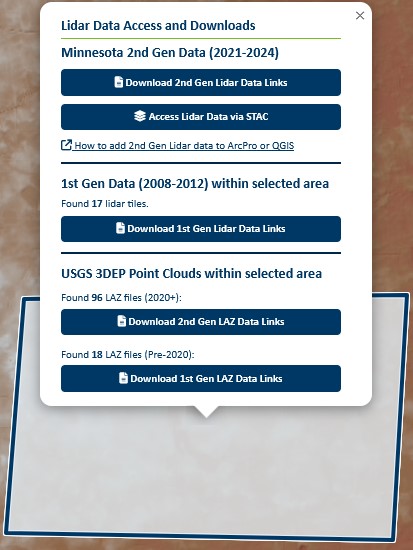
- Zoom in to the study extent. This should be an area 100 sq miles or smaller. Click on the map to draw a polygon around the area of interest. Double-click to complete the bounding polygon. A pop up will display, including links to 2nd generation, 1st generation, and USGS 3DEP Point Cloud data products, if available.
- For more information about downloading data, please view the download instructions page.
Map Display
The map basemap and layers panel can be found on the top right of the map window. It can be opened by scrolling over the icon. Some layers have opacity control sliders so that users may manually adjust the opacity. The default layer opacity is 80%.
- Collapsed map layers icon:

- Open map layers panel:
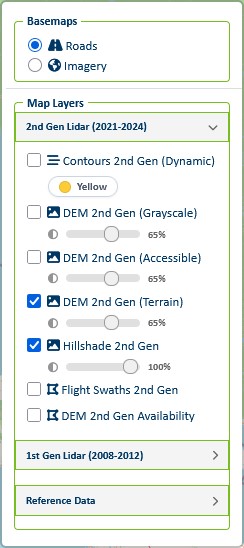
Basemaps
There are two basemap options available for the MnTopo application: Roads (OpenStreetMap) and Satellite (Esri). The application default basemap is roads.
Map Layers
| Map Layer | Layer Description |
|---|---|
| Contours 2nd Generation (Dynamic) | Contours are generated from the Second generation statewide seamless lidar DEM using Esri’s on-the-fly (dynamic) contour function, which creates contour lines by connecting points of equal elevation from a raster elevation surface. Contour intervals adjust dynamically with map scale, displaying both index and intermediate contours as you zoom in and out. These contours are intended for visualization purposes only and are not authoritative. MnGeo plans to publish authoritative contours from 3D Geomatics in the near future. The contours have a minimum zoom level of 12. |
| DEM 2nd Gen (Greyscale) | Second generation statewide seamless lidar DEM |
| DEM 2nd Gen (Accessible) | Second generation statewide seamless lidar DEM; Sequential, colorblind-friendly colors designed for clear printing and reproduction. |
| DEM 2nd Gen (Terrain) | Second generation statewide seamless lidar DEM; Sequential colors designed to enhance the appearance of terrain for clear printing and reproduction. |
| Hillshade 2nd Gen | Second generation statewide seamless lidar DEM; Hillshade created dynamically from the 2nd Gen DEM using an ESRI function. Shadows and terrain features are enhanced to make hills and valleys more visible. |
| Flight Swaths 2nd Gen | Second generation lidar flight swaths |
| DEM 2nd Gen Availability | Reference layer intended to provide context about incomplete portions of statewide lidar data. This layer is an approximate representation of boundaries and may not exactly align with existing lidar data. |
| Contours (50ft) 1st Gen | First generation 50ft countours |
| Contours (10ft) 1st Gen | First generation 10ft countours (min zoom level 15) |
| Contours (2ft) 1st Gen | First generation 2ft countours (min zoom level 16) |
| DEM 1st Gen (Color) | First generation lidar DEM image service (max zoom level 17) |
| DEM 1st Gen (Elevation) | First generation DEM elevation service |
| Hillshade 1st Gen | First generation Minnesota hillshade (max zoom level 12) |
| FEMA Floodplain 1st Gen | First generation FEMA modernized and unmodernized Flood Hazard Zones (min zoom level 12) |
| County Boundaries | Minnesota Counties |
Flight Swaths
Flight swath vector polygons were delivered to MnGeo by vendors for the respective LABs and/or work units lidar data was collected for, and provide spatial and temporal context for the lidar DEM layers. To explore flight swaths, enable the layer on the MnTopo web application and hover over any feature to highlight it. Select a feature to view the work unit, flight date, and link to associated work unit metadata.
The flight swaths are also available as a feature service or downloadable resource for detailed analysis. Please view the list of available layers on MnGeo's lidar homepage to access the link to the Minnesota Geospatial Commons resource.
FEMA Floodplain Boundaries
The 100-year FEMA floodplain boundaries are included as an option for display on the MnTopo web application. The layer is classified as modernized or unmodernized based on the county. Modernized floodplains reflect Digital Flood Insurance Rate Map that FEMA has updated since 2003, while unmodernized floodplains reflect counties that use paper maps. Please refer to the Minnesota DNR Floodplain Management page for more information about floodplain data, although some digital information is also available. Floodplain data and metadata is available on the Minnesota Geospatial Commons.
Dynamic 2nd Generation Contours
The 2nd generation contours are drawn dynamically from the Second generation statewide seamless lidar DEM using Esri’s on-the-fly (dynamic) contour function. The index and intermediate contours adjust based on the zoom level. Users may select the display color of the contours by toggling the color button in the layers menu; the contours may be displayed in yellow, red, or black. The current values of the index and intermerdiate contours are displayed in the dynamic legend:
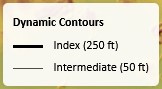
These contours are intended for visualization purposes only and are not authoritative.
Zoom Scale
A zoom level or scale is a number that defines how large or small the contents of a map appear in a map view:
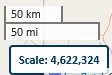
- Scale is a ratio between measurements on a map view and measurements in the real-world. When a map is displayed at a scale of 1:100 (or simply 100.0), 1cm on the display represents 1m (100cm) in the real world. A scale of 100,000.0 means that 1cm on the map display represents 1km (100,000cm) in the real world, and so on.
- Zoom level is a number between 0 (global view) and 23 (very detailed view) and is used as a shorthand for predetermined scale values, but comes with some limitations.
- Most web mapping APIs support zoom levels as a convenience. Zoom levels are only typically used for building applications that display data in Web Mercator projection. Scales are used to display data in any projection.
Zoom to Extent
The zoom to extent button will automatically reset the map extent to the default Minnesota bounding box:

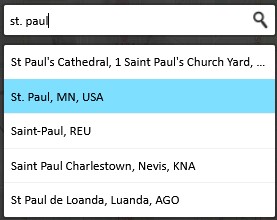
Search
Click on the search widget to expand the search bar. Enter an address, place name, or coordinates in decimal degrees. Complete the search by selecting the correct location from the search results. The map view will zoom to the selected location.
- Collapsed search widget:

- Search example:
Print Screen
To print a portion of the map, please use the print screen option on your device.
MacOS:
- Full screen: Command + Shift + 3
- Selection: Command + Shift + 4
- Window: Command + Shift + 4, then Space
Linux:
- Full screen: PrtScn
- Active window: Alt + PrtScn
- Selection: Shift + PrtScn
Windows:
- Alt + PrtScn > Captures just the window you’re currently using > Pastes with Ctrl + V
- Windows key + PrtScn > Screen briefly dims > Image is saved automatically to: Pictures → Screenshots
- Windows key + Shift + S > Opens Snipping Tool overlay > Use mouse or arrow keys to select area > Screenshot is copied to clipboard > Paste with Ctrl + V